Examples of c3 research
The following graphs show the typical impact achieved through the use of C3 products
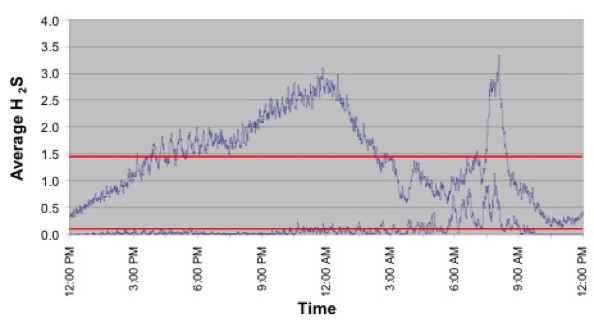
Odour ControlThe graph shows a 96% reduction in the level of H2S gas produced in a sewage catchment after the application of C3 products. The upper red line represents the daily average before C3 treatment and the lower red line, the daily average after C3 treatment. Typical results range from about 75% to 98% reduction in H2S odour generation.
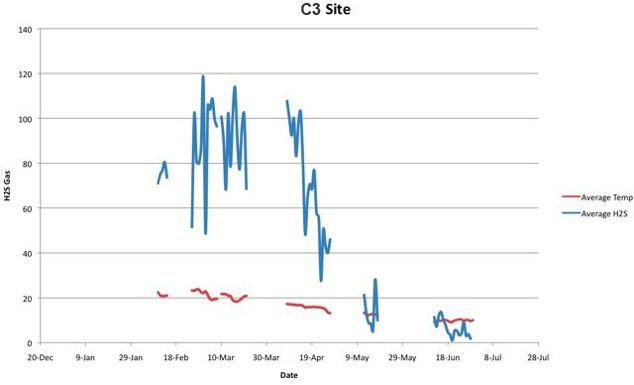
The graph below show that it can take some time for the reduction in sewage odour to begin to occur in sewer pipes. |
|
As previously mentioned, C3 products are reliant on treating the cause of the sewer odour and methane gas production. That means that the products must remove the biofilm / sediment in the sewer main to achieve reductions in both sewage odour and methane gas production.
Dissolved Oxygen
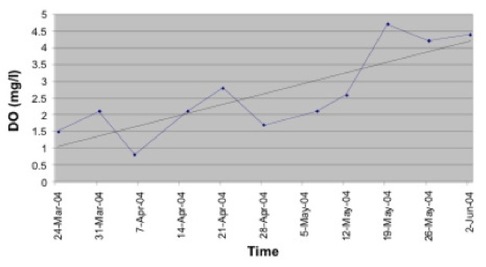
Sending bacteria into so called “hibernation” will reduced the oxygen demand in the sewage catchment. This will result in trend increases in dissolved oxygen, which are routinely observed. Increasing oxygen levels is indicative that offensive sulphurous odours will be minimised and carbon is being preserved in the sewage catchment.
Sludge Volume index
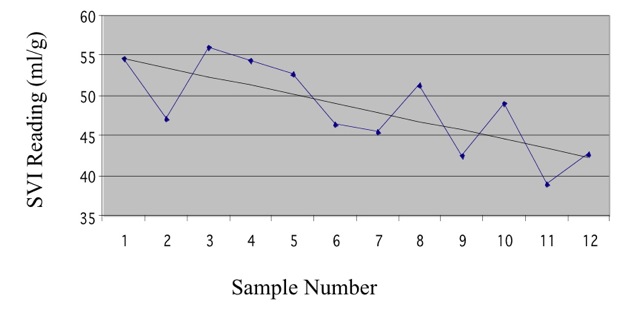
The above graph indicates improved sewage process and better sludge settle-ability. The scale 1 - 12 represents weeks
